Visualizzare le visualizzazioni

categorie

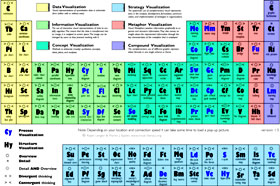
Arguto esercizio visuale: una tabella dei modi di visualizzare dati organizzata come la tavola degli elementi.

Ottima per prendere ispirazione su come organizzarsi le idee o effettuare una presentazione, per scoprire nuovi strumenti e nuove vie di aggregazione delle informazioni. Dalle tree-map alle mind-map, dalle simulazioni di sistemi dinamici ai cartoon.

"A periodic table of visualization methods"

Add new comment

The content of this field is kept private and will not be shown publicly.

Full HTML 2

  • Web page addresses and email addresses turn into links automatically.
  • Lines and paragraphs break automatically.

Filtered HTML

  • Web page addresses and email addresses turn into links automatically.
  • Allowed HTML tags: <a href hreflang> <em> <strong> <cite> <blockquote cite> <code> <ul type> <ol start type='1 A I'> <li> <dl> <dt> <dd> <h2 id='jump-*'> <h3 id> <h4 id> <h5 id> <h6 id>
  • Lines and paragraphs break automatically.
CAPTCHA
This question is for testing whether or not you are a human visitor and to prevent automated spam submissions.