La Storia in un Diagramma

categorie

histography


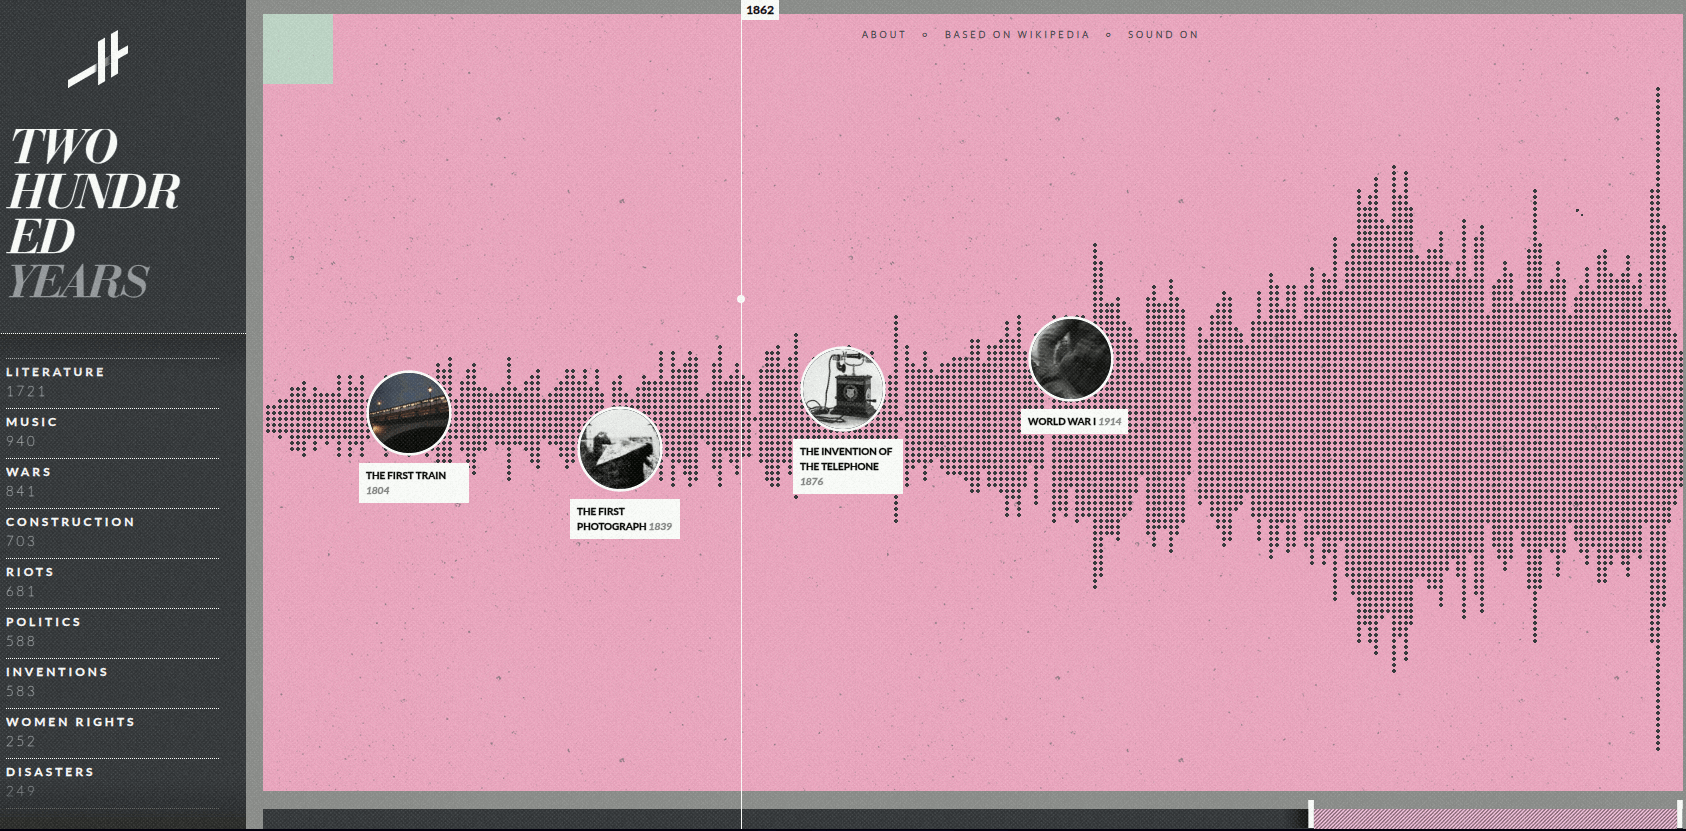
Su histography.io ogni evento storico è un punto in un diagramma che si estende 14 miliardi di anni, con un focus particolare negli ultimi 25.000. Copre dal Big Bang fino al 2015. Si può osservare un determinato periodo, da una decade ad un milione di anni, e verificare cosa sia successo a colpo d'occhio. Gli eventi sono classificati per tipo.

Oltre ad essere bello da vedere ed elegante, è particolarmente utile per avere un senso della storia e approfondirlo a piacere.

About


Add new comment

The content of this field is kept private and will not be shown publicly.

Full HTML 2

  • Web page addresses and email addresses turn into links automatically.
  • Lines and paragraphs break automatically.

Filtered HTML

  • Web page addresses and email addresses turn into links automatically.
  • Allowed HTML tags: <a href hreflang> <em> <strong> <cite> <blockquote cite> <code> <ul type> <ol start type='1 A I'> <li> <dl> <dt> <dd> <h2 id='jump-*'> <h3 id> <h4 id> <h5 id> <h6 id>
  • Lines and paragraphs break automatically.
CAPTCHA
This question is for testing whether or not you are a human visitor and to prevent automated spam submissions.