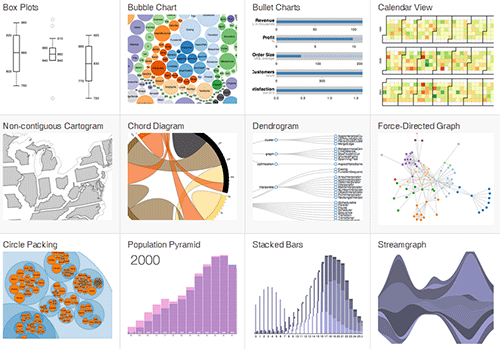
D3 è una libreria javascript per manipolare documenti basandosi su dati. Fa uso di HTML, SVG e CSS.
D3 combina un sistema di visualizzazione potente, elastico e versatile, visto che l'elaborazione della rappresentazione avviene direttamente nel browser. Ad esempio è possibile rappresentare diagrammi di nodi semplicemente creando un JSON con i valori in una lista e scegliendo il modulo di visualizzazione più appropriato.
10 Years of Open-Source Visualization
★ plotly.js
★ cindy.js
Tutorials
API reference
plugins
stackoverflow
★ Data Visualization Course with D3.js
Infographics tools:
vizualize.me
google dev
easel.ly
piktochart
infogr.am
visual.ly
venngage
dipity
Infographics sites:
flowing data
Filosofia:
Ludwig Wittgenstein Tractatus Tree
Data Visualization Course with D3.js - Full Tutorial Course
Data Visualization with D3.js - Full Tutorial Course
Add new comment